AAAAA SSSSS TTTTTTT RRRRRR OOOOO L OOOOO GGGGG
A A S S T R R O O L O O G G
A A S T R R O O L O O G
AAAAAAA SSSSS T RRRRRR O O L O O G GGGG
A A S T R R O O L O O G G
A A S S T R R O O L O O G G
A A SSSSS T R R OOOOO LLLLLLL OOOOO GGGGG
** VERSION 6.50 **
Release notes for Astrolog version 6.50 (July 2019):
Happy start of Leo everyone! :) This file describes the freeware astrology software program Astrolog version 6.50 and the additions and fixes made to it, over the previous version 6.40 which was released exactly one year ago in July 2018. The main things in this update are 3D astrocartography charts (instead of just 2D rectangular charts), more support for stars, and a number of bug fixes.
Here are new additions to version 6.50 that weren't in previous versions:
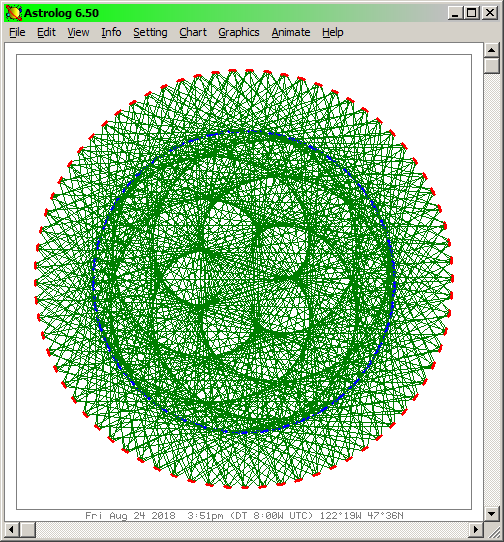
1. 3D astro-graph charts: Astrolog supports 3D graphic astrocartography charts, which are drawn on a spherical globe instead of just a flat rectangular map. This globe can be rotated and animated, and in the Windows version you can right click and drag to view different parts of the world. To display a 3D astro-graph chart, select the “Graphics / Show Globe” command (-XG switch on the command line). The 3D astro-graph is a separate chart from Astrolog’s existing classic astro-graph chart (accessed with -L -X switches). You can even toggle between them with the “3D Houses” command (-c3 switch or “a” hotkey).
As with the classic 2D astro-graph chart, by default Midheaven lines are yellow, Ascendant lines are red, Descendant lines are green, and Nadir lines are blue. The Midheaven lines will be labeled at the planet’s zenith point, Nadir lines at the planet’s nadir point, and Ascendant and Descendant lines at Earth’s equator. Midheaven and Ascendant lines have glyphs in the planet’s color, while Descendant and Nadir lines always have glyphs in gray. The presence of Midheaven, Ascendant, Descendant, and Nadir lines can each be individually toggled with the “Rising and Setting Restrictions” in Display Settings (-YRZ switch). If all four are restricted, then planets will still be plotted but only at their zenith points, which duplicates behavior from previous versions. A magenta dot will be drawn at the location for the chart, with a dotted line around that latitude in order to make latitude crossings near the location more apparent. This dot can be turned off by toggling the “Text Astro-Graph Shows Latitude Crossings” flag in Chart Settings (-L0 switch).
Internally, the 3D astro-graph chart is part of Astrolog’s globe display, which even in previous versions would plot the zenith location of each planet on the map. This feature just extends it by also drawing each planet’s four sets of lines upon the globe. That means astro-graph lines are supported on Astrolog’s other world map displays, namely the rectangular world map (including the oval shaped Mollewide projection of it), and polar projection world map. The rectangular world map (-XW switch) is very similar to Astrolog’s existing graphic astro-graph chart (-L -X switches), except for differences in how the lines are labeled. (Users may prefer one style to the other.) You can switch between the two styles of rectangular astro-graph chart with the “L” (for classic astro-graph chart) and “W” (for world map showing astro-graph lines) hotkeys.
2. Sunshine houses: Astrolog now supports the Sunshine system of house division. Similar to APC houses, in Sunshine houses non-angular cusps aren’t always 180 degrees opposite each other. Near the poles, Sunshine houses can have five cusps in a row overlapping, and therefore have four houses in row zero sized. In the Windows version this system can be selected with a new menu command on the “House System” submenu. On the command line, Sunshine houses can be accessed with “-c 20”.
3. Mixed progressions: Astrolog supports a mixed progression mode in which the planets are secondary progressed (meaning planetary positions are computed at a future date) but house cusps are progressed by solar arc (meaning the same offset is applied to all cusps). In the Progressions dialog, select the new “Secondary (Solar Arc Cusps)” option to compute in this manner. From the command line, use the new -p1 switch to do progressions of this type. (Note that “p1” can be used in all switch contexts that “p” for secondary progressions can, and “p0” for solar arc progressions can.)
4. Cusp progression factor: The rate that progressed house cusps move (whether computed or by solar arc) compared to the default can be specified. In the Progressions dialog, change the new “Cusp Move Ratio” field to define the slowness factor to apply to progressed house cusps. From the command line, use the new -pC <number> switch to set this value. For example, Astrolog’s default for secondary progressions is quotidian, which means the cusps move 360 degrees around the zodiac each day. However, other types of progression have the cusps move the same speed as the Sun. Change the cusp move ratio field from “1” to “365.24219” (values are in the dropdown) and that will make cusps move 365.24219 times slower, which will make them move just 1 degree per day, about the same as the Sun.
5. Ecliptic axis: Astrolog’s chart sphere and local horizon charts use the local horizon for its “equator”, while Astrolog’s globe charts are aligned with the Earth’s equator. These charts can be tilted so they’re aligned with the ecliptic instead, with the new “Use Ecliptic Axis” command on the “Graphics / Map Effects” submenu (or use the new -YXe switch on the command line). When in this mode, rotating and tilting the globe will do so relative to the ecliptic.
6. Star distance ordering: Lists of fixed star objects (such as in text charts and in the wheel chart sidebar) can be ordered by distance from the viewer. Select the new “By Distance” option in the “Fixed Star Ordering” section of the Chart Settings dialog (or use the new -Ud switch on the command line). Note that determining star distances requires Swiss Ephemeris to be the calculation method. Older calculation methods will assume all stars are exactly 100 light years away from our Sun.
7. New aspect sorting methods: Aspect sorting in the aspect list chart, and in the transit influence charts (-a, -D, and -T switches) can be sorted by two new methods. The -a switch can be invoked as -aP to sort by the name of the second object forming the aspect (similar to how -aO sorts by the name of the first object forming the aspect). The -a switch can also be invoked as -aD to sort by the zodiac position of the second object (similar to how -aC sorts by the position of the first object).
8. Search paths: The new -Yi <path> switch is a way to specify search paths for loading files, such as ephemeris files and chart information files. This switch takes one parameter indicating a directory to look within for files. There are actually ten different switches -Yi0 through -Yi9 (in which -Yi by itself is equivalent to -Yi0) which can cover ten different paths. The default astrolog.as default settings file contains a couple instances of -Yi pointing to sample directories. Note that -Yi can’t be used to help find astrolog.as itself for its initial loading, because the astrolog.as file is loaded early before even the command line is processed. However, because the directory of the executable is searched before anything else, placing astrolog.as next to the executable will ensure it’s found, and -Yi switches inside astrolog.as can be used to point to any other paths. System environment variables pointing to directories such as ASTROLOG are still supported, but are no longer necessary to define file paths.
9. Central planet autorestriction: Changing the central planet will now automatically unrestrict the old central planet and restrict the new central planet from appearing in charts. For example, switching from geocentric to heliocentric (through either the Windows interface or the command line) will automatically restrict the Sun and unrestrict the Earth to reflect what looks best in a heliocentric chart. Restrictions will only be changed if both the old central planet is restricted and the new central planet is unrestricted. This behavior is active by default, but can be prevented with the new -YRh switch. If turned on, then no restrictions will change when the central planet is changed.
10. Aspect line dashedness: In graphics charts, dashed lines are used when drawing aspect lines whose orbs aren’t exact, with more space between points indicating a wider orb. The -YXa <num> switch indicates the maximum number of pixels allowed to be skipped between set pixels. Limits are useful to prevent very wide orbs from being hard to see. Images such as http://www.astrolog.org/astrolog/pic/orbit2.png (which compares Earth’s to Venus’ orbit over time) are generated by having 360 degree orbs, or always drawing a line between two planets (and never with any dashedness in them, so -YXa 0 is used).
If the parameter is negative, then that modifies aspect lines so that exact aspects are drawn solid, and aspects at the orb limit for the aspect in question are drawn with <num> spaces between points. This may be preferred to the default behavior in which the dashedness of the line is only based on the number of degrees the aspect is different from exact. The default behavior will result in aspects to the North Node (which by default only allows a two degree orb to it) to always be nearly solid, even if the aspect is near the orb limit for being shown at all. The Modify Display command (-Xi switch) will toggle between these two display modes (i.e. it negates the value of the -YXa switch).
11. Solar system sidereal: The new “Solar System Sidereal” flag in the Calculation Settings dialog (-Ys switch) will modify sidereal zodiac positions to be relative to the plane of the solar system (instead of relative to the plane of the ecliptic, which is the default). The difference is subtle, especially for centuries near the present, however the solar system plane is stable relative to the background of stars, in comparison to the ecliptic which does change over time. As a result this option is useful for stellar animations spanning many thousands of years. For example, the animation http://www.astrolog.org/astrolog/screen/dipper2.gif covering a million years was generated with this setting on.
12. Color palette updating: The new -YXK switch can be used to redefine the actual colors within Astrolog’s default color palette. It takes two parameters, the name of the color to redefine, and the new RGB color value to use for that color index. The RGB color value can either be a three comma separated decimal numbers, or the “#” character followed by three two character hexadecimal numbers in sequence. For example, “-YXK Orange 255,127,0” or “-YXK Orange #ff7f00” will change the color “Orange” from the dark yellow that’s the default to an actual fiery orange color.
13. Extra star labeling: The -XU switch to display the list of additional stars can have the stars displayed as larger dots, and can also have the stars labeled with their names. Stars will be labeled with their traditional or common name (if any), otherwise by their scientific nomenclature abbreviation. The -XU switch can be invoked as -XU1 to turn on larger dot placement, -XU2 to turn on name labeling, -XU3 to do both, and -XU0 to do neither.
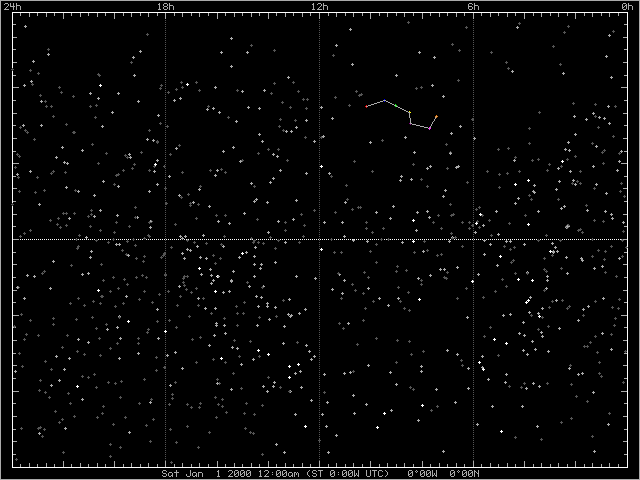
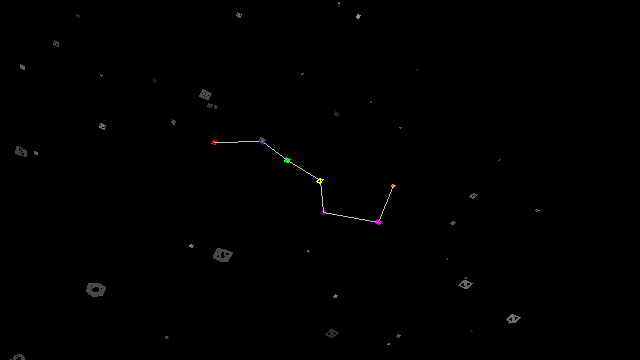
14. Extra star colors: The new -YkU switch can be used to specify colors to use for particular extra stars when the Show All Stars setting (-XU switch) is active. It takes one parameter, which is a comma separated list of string pairs. These pairs indicate the name of a star followed by the name of the color to use for it. For example, “-YkU Alkaid,Red,Mizar,Blue,Alioth,Green,Megrez,Yellow,Dubhe,Orange,Merak,Magenta,Phecda,Purple” will highlight the seven stars of the Big Dipper in the seven Ray colors.
15. Extra star restrictions: The collection of extra stars shown by the Show All Stars setting (-XU switch) supports ways of focusing upon or excluding certain stars. The new -YRU switch will restrict certain stars from appearing, while the -YRU0 switch will make only certain stars appear and ignore all the rest. It takes one parameter, which is a comma separated list of strings indicating star names. For example, “-YRU0 Alkaid,Mizar,Alioth,Megrez,Phecda,Merak,Dubhe” will make the extra stars feature only show the seven stars of the Big Dipper, and skip all other stars.
16. Extra star lines: When the extra stars shown by the Show All Stars setting (-XU switch) are drawn, lines can be drawn between certain pairs of stars. The new -YXU switch will define what stars to draw lines between. It takes two parameters, a comma separated list of strings indicating stars that may have lines connected to them, and a comma separated list of number pairs indicating indexes of stars within the list of strings to connect. For example, “-YXU Alkaid,Mizar,Alioth,Megrez,Phecda,Merak,Dubhe 0,1,1,2,2,3,3,4,4,5,5,6” will draw lines among the seven stars of the Big Dipper.
17. Monthly rising and setting: The -Zd switch which prints rising and setting times has been extended to support scanning an entire month, year, or range of years. The -Zdm switch will scan the entire month, the -Zdy switch will scan the whole year, and the -ZdY <years> switch will scan the number of years specified starting with the current year.
18. Windows hourglass: The new -Wh switch toggles whether the Windows version shows an hourglass mouse pointer while calculating and drawing charts. This setting is on by default, but one may want to turn it off during animations to prevent the mouse pointer from continually flashing to and from the hourglass.
19. Disable warnings: The new -Wt switch disables warning popup messages in the Windows version, such as ephemeris files not being found. One scenario where this can be used is star charts for the distant past or future. Heliocentric barycentric positions of fixed stars don’t require calculating the position of the Sun, and therefore can be calculated for any date and don’t depend on ephemeris files being available. However, Astrolog will still warn about dates out of range, which can be ignored in this scenario. For example, the animation http://www.astrolog.org/astrolog/screen/dipper2.gif covering a million years was generated with -Wt on.
--
Here's a summary of the 17 new command switches in Astrolog 6.50 that weren't in previous versions:
-a[jonOPACDm]: Sort aspects by power, orb, orb difference, 1st planet, 2nd planet, aspect, 1st position, 2nd position, midpoint.
-Zd[m,y,Y] [<years>]: Like _Zd but for entire month, year, or years.
-U[z,l,n,b,d]: Sort by position, lati, name, brightness, or distance.
-p1 <month> <day> <year>: Like _p but with solar arc cusps only.
-pC <days>: Set factor to use when progressing cusps (default 1.0).
-Ys: Sidereal zodiac positions are in plane of solar system.
-Yi[0-9] <path>: Specify directory to search within for files.
-YRh: Don't auto(un)restrict central planet when changing it.
-YRU[0] <starlist>: Restrict or focus on list of extra stars.
-YkU <starlist>: Customize list of extra star colors.
-YXK <col> <rgb>: Customize RGB value of color index.
-YXe: Align certain charts to ecliptic.
-YXa <num>: Set limit to dashedness in aspect lines drawn.
-YXU <starlist> <linklist>: Define lines between extra stars.
-XU[0-3]: Like _XU but set whether to show larger star dot and name.
-Wh: Set hourglass cursor when redrawing chart.
-Wt: Don't display warning and error popup messages.
Here's a summary of the 2 new menu commands in the Windows version of Astrolog 6.50 that weren't in previous versions:
Setting / House System / Sunshine
Graphics / Show Map Effects / Use Ecliptic Axis
A list of improvements to existing features in Astrolog 6.50, such as new things you can now do with old features that you couldn’t do before, or ways existing features work better than before:
1. 3D star positions: Astrolog’s graphic Solar System Orbit chart (-S -X switches) will now display star objects, as well as the list of additional stars. If stars objects are unrestricted, or the list of additional stars is being shown, then their positions will be plotted in this chart. Because stars are so far away, the chart scaling will be in light years instead of Astronomical Units (AU), which is a factor of about 63000. That will make all planets appear to be overlapping in the middle of the chart, and as a result when showing stars it’s recommended to restrict all non-star objects except the Sun. Astrolog’s 3D wireframe file of this chart will plot stars in 3D space, resulting in a 3D environment in which one can explore the local area of the galaxy. For example, the Astrolog animation http://www.astrolog.org/astrolog/screen/dipper.gif flies through space around the Big Dipper, allowing one to see how it appears from different angles.
Astrolog’s text mode Solar System Orbit chart will also now display star objects. For stars, the “Length” column will measure light years (instead of Astronomical Units, as is done for planets). Note 1 light year is about 63000 AU, so the stars are actually more distant by this factor.
2. Star centered charts: The central planet setting (-h switch) allows doing heliocentric or other planet centered charts. This has been extended to support star objects. This means you can cast a chart centered on another star, and see how the stars and constellations appear from the position of that star. Stars are very far apart from each other, and the closest star to our Sun is 4.4 light years away, or nearly 10,000 times farther away than Neptune. As a result, from other star systems all the planets will appear very close to the Sun (within one arc minute or even narrower depending on the star). Note that the object “Andromeda” or M31 is actually a galaxy, which means casting a chart centered on it will actually do a chart from the perspective of another galaxy! Because the Andromeda galaxy is 2.5 million light years away, from its point of view all the other stars will appear very close together (within 3.5 arc minutes).
3. All stars in object list: The object list table (-HO switch) will include the list of additional stars if the Show All Stars setting (-XU switch) is on. The extra stars will be in a separate list after the main list of objects. For each star it will show the scientific nomenclature abbreviation (in which something like “alCyg” means Alpha Cygni), the current zodiac position and ecliptic latitude of the star, it’s magnitude or brightness, and finally its traditional or common name (if any). Rows will be colored dark gray (for dim stars magnitude 4.0 or above), light gray, or white (for bright stars below magnitude 2.0).
4. Stars in planet info: The list planet information table (-HS switch) will include star objects if they’re unrestricted. For stars, the “Distance” column will measure light years (instead of Astronomical Units as is done for planets) which is a factor of about 63000.
5. Logarithmic moon orbit: In the graphic Solar System Orbit chart (-S -X switches), having the 3D Houses setting on causes planet distances from the central object to be rendered on a logarithmic scale, to make orbits roughly equally spaced and prevent inner planets from being squished together. This option now also affects the Moon’s orbit around the Earth, and makes lunar objects appear a visible distance from the Earth. The video https://www.youtube.com/watch?v=jSZzytVUzgI shows this in action, in which the Moon can be seen orbiting the Earth, while Earth and the other planets can be seen orbiting the Sun.
6. Chart sphere directions: The graphic chart sphere is now affected by the “Rising and Setting Restrictions” in Display Settings (-YRZ switch). The four lines from the center of the sphere to the North/South/West/East points on the horizon will only be displayed if the corresponding Nadir/Zenith/Setting/Rising flag is unrestricted. If all four are restricted, then the prime vertical line across the sphere will go away too. If all four are restricted and the show house details setting is off as well, then the horizon and meridian lines will go away too, leaving just the lines of the ecliptic marking the signs of the zodiac. (This last scenario goes well with turning on the new Use Ecliptic Axis setting, to align the sphere with the ecliptic.)
7. More aspect sorting: The nine different options for methods of sorting aspects (specified as subswitches to -a) apply to additional charts. They now apply to the relationship comparison version of the aspect list (-a -r0 switches), and the transit influence charts (-D and -T switches).
8. Aspect details: Aspects listed in various charts display the sign of the objects making the aspects. If the “Print Nearest Second” setting is on (-b0 switch) these positions will now be printed to the nearest arc-minute. This affects the aspect list, midpoint list, transit to transit times and influence charts, and transit to natal times and influence charts (-a, -m, -d, -D, -t, and -T switches).
9. House cusp transits: The “Transit To Transit Times” chart (-d switch) will now include house cusp objects if the “Graphs Include All Planets” setting is on (-B0/V0 switches). Normally cusp objects like the Ascendant are always excluded from this chart (even if unrestricted) to avoid too many aspects being displayed. This is now an option if you want to see when planets conjunct house cusps, which also means when during the day they move between houses.
10. Transit graph scrolling: In the Windows version, the vertical scrollbar can be used to scroll down the list of aspects in the graphical transit charts (-B/-V -X switches). Before if there were too many aspects for the window height, there was no way to see the rest other than resizing the window taller or restricting content.
11. Yearly ephemeris interface: In the Windows version, there’s a new “Ephemeris Is For Entire Year” checkbox in the Chart Settings dialog, which allows toggling between the monthly and yearly ephemeris tables. This option was already available through the “Modify Chart” command or the command line, but it’s more easily discovered here.
12. Text background colors: In the Windows version, text mode charts (with the “Show Graphics” command setting off) may have backgrounds of any color. The background is by default back or white (as determined by the “Reverse Background” command setting) and can be changed by redefining these colors in the standard color palette.
13. Cusp latitudes: House cusp objects will now have their latitudes listed in the standard listing (-v switch). Before, latitudes would always be blank for cusps. House cusp objects are on the ecliptic and so usually have latitude 0, however settings like “Equatorial Positions” in Calculation Settings (-sr switch) can change them.
14. Sidebar cusps: The graphic wheel chart sidebar can now include house cusp objects in the list of planets. Each cusp object will only be included if it’s different from the actual house cusp. Normally cusp objects are redundant, since the positions of the 12 houses are already listed, however (for example) some house systems have the Ascendant different from the 1st house, or the Midheaven different from the 10th, which means it’s important to list them.
15. Non-star skipping: The list of additional stars (-XU switch) will only include physical stars and skip “virtual” bodies such as the galactic pole, if the “Graphs Include All Planets” setting in the Transits dialog is off (-B0/V0 switches). This will reduce the number of stars in the additional stars list from 1111 to 1100. Non-star points like this are apparent in the sefstars.txt star list file because they have non-standard magnitudes like 0.0 or 999.99.
16. Astro-graph line improvement: The graphic astro-graph chart (-L -X switches) uses red for Ascendant lines and green for Descendant lines, and when two of these lines meet, a horizontal gray line would connect them. This no longer happens, and the connecting line is half red and half green in the appropriate proportion. Note that Ascendant and Descendant lines touch at the high or low latitude marks, and those points are intersected by the planet’s Midheaven or Nadir lines.
17. Smoother glyphs: Astrolog has a new set of sign and house glyphs used when the character scale is 300% or “Large”. They will make charts at this scale look smoother, instead of just drawing the small 100% scale glyphs at triple scale, which looked blocky.
18. Improved labeling: The type of chart will be more accurately labeled in the text mode wheel chart (-w switch), and in the graphic sidebar. Topocentric charts will be labeled as such (instead of just as geocentric), and barycentric charts will be labeled as such (instead of just as heliocentric).
19. More sidebar labeling: The graphic sidebar will include additional lines to indicate less common chart types, which makes it easier to see when a particular mode is in effect. Included will be whether the chart is progressed (and if so what date it’s progressed to), along with special indicators if the decan, dwad, domal, or geodetic houses settings are on. Solar charts will be indicated too, and will mention how the planet positions are being rotated. It will indicate what planet is being rotated to what position, and whether the rotating is to the start of sign, e.g. “Sun on Ascendant” or “Moon’s sign on Midheaven”.
20. Horizon charts separate: On the command line, the text mode local horizon chart (-Z switch) is now considered a distinct chart from the rising and setting times table (-Zd switch). That means they can both be displayed at once if both switches are included, and also the -e switch to display all charts will now include both.
A few changes that aren't new feature additions or bug fixes have been made to Astrolog 6.50, which means certain old assumptions are no longer valid. Most can be considered improvements, but they still change existing behavior. A list of these follows (which aren't useful to be aware of unless you have used previous versions of the program):
1. Map defaults: In the Windows version, the world map and globe charts start out showing planets at their zenith locations. (And beyond that will show meridian lines and the entire astro-graph chart by default, as described in the new 3D astro-graph feature.) You have to enter the Modify Display mode (-Xi switch or “i” hotkey) to switch to showing only the world map. Before, the map displays would start out only showing the map, which means the effect of the Modify Display mode has been reversed for how it affects maps.
2. Time / Space midpoint interface: In the Windows version, the “Time / Space Midpoint” relationship chart command will now stay in this mode, after replacing chart #1 with the midpoint of chart #1 and chart #2. The original contents of chart #1 will be stored in the “previous” chart slot, and will be restored upon exiting the mode. After exiting this mode, the “previous” chart slot will contain the information for the midpoint chart. Before, this command would replace chart #1 with the midpoint, and then immediately exit the relationship chart mode, which would clobber the data for chart #1 and make it harder to switch back and forth between modes.
3. Wheel aspects interface: In graphic wheel charts, showing aspect lines in the middle of the wheel is no longer toggled with the Modify Display command (-Xi switch or “i” hotkey). It’s now toggled with the Show Equator setting (-Xe switch or “e” hotkey). The Modify Display command now toggles the dashedness of the aspect lines in the middle of the wheel (i.e. it negates the value of the new -YXa switch).
4. Location setting changed: Right clicking on astro-graph charts and world maps will no longer set the chart location to the point clicked upon. Right clicking and dragging will now rotate or slide the world map chart in the same way you can right click and drag to rotate globes and chart spheres. One can still relocate on astro-graph and world map charts by Alt+left clicking on them.
5. Environment variable renamed: The version specific environment variable for file paths in Astrolog 6.50 is “ASTR650”. Previous versions has a period present, e.g. the previous version’s environment variable was “ASTR6.40”. This change is because some environments such as Unix don’t allow periods in environment variables.
6. Star renamed: The fixed star object “Rigel Kent.” has been renamed to “Rigil Kent.” because the latter spelling is more common. It also makes this star (Rigil Kentaurus, also known as Alpha Centauri) more easily distinguished from “Rigel” (the brightest star in Orion).
7. Documentation renamed: In the Windows version, the “Open Helpfile” command is now “Open Documentation”. Also, this command now appears at the top of the Help menu, in addition to on the “More Documentation” submenu.
8. Constellation grid setting: The rectangular constellation map (-XF switch) would show a grid of dots for scale sizes 300% and above. These dots become clutter if also displaying the list of additional stars. This grid will now only be shown if the 3D Houses setting is also on.
Here are bugs or other issues with version 6.40, all of which have been corrected in this release:
1. Time zone inaccuracy: Half hour time zone abbreviations mapped to incorrect offsets. For example, selecting “HST” in the time zone dropdown (or passing “HST” to the -z switch) would be treated as a time zone 18 minutes instead of 30 minutes after the hour.
2. Daylight time corruption: Saving chart information when the Daylight time field is anything other than “Yes” or “No” (which includes “Autodetect” in the Windows version) would save a bad value to file. A copy of the time zone would be saved instead of the Daylight field, which would distort the chart by that amount if reloaded.
3. Chart position latitude saving: Chart position files wouldn’t correctly save objects whose ecliptic latitude was between 0 and -1 degrees. Reloading would drop the negative and place the planet between 0 and 1 degrees.
4. Transit graph years: The -Vy and -VY switches to do a transit to natal graph for a year or five year period would only do a graph for a single month. This only affected the command line, and not when selecting a year or years in the Windows version.
5. Star sidereal bug: Fixed stars would be positioned incorrectly when the sidereal zodiac was on, because the tropical to sidereal offset would be applied twice. This affected the 47 main fixed star objects, and not the extra list of 1100 stars which were computed correctly.
6. Star velocity inaccuracy: Star velocities were only implemented in a primitive fashion, in that sidereal zodiac stars were always velocity 0, and tropical zodiac star velocities were always the slow average precession rate, and also the velocities relative to average speed setting (-v0 switch) wouldn’t have any effect. Star velocities are accurate now, and will be different for different stars based on their individual (very slow) proper motions. They will also vary for geocentric charts, because Earth’s orbit around the Sun produces a minor parallax effect which can cause stars to appear retrograde at times. Star velocities will also be affected by the average speed setting (-v0 switch) at least for the tropical zodiac. (In the sidereal zodiac the average speed of a star is 0 since there’s no precession, and as a result average speed can’t be computed since you can’t divide by zero.)
7. Extra stars adjustment omission: The positions of the additional list of stars (-XU switch) wouldn’t take into account various settings. The additional stars are now affected by the settings for harmonic charts (-x switch), decans (-3 switch), dwads (-4 switch), and navamsas (-9 switch).
8. Extra stars bitmap omission: In the Windows version, saving the graphics chart to Windows bitmap format or copying a bitmap to the clipboard wouldn’t include the list of additional stars in the bitmap file.
9. Extra stars monochrome omission: Monochrome mode (-Xm switch) wouldn’t affect the display of additional stars in the Windows version, and such stars would still be displayed in multiple shades of gray.
10. Latitude ephemeris display inaccuracy: The graphic ephemeris when graphing planetary latitudes (-E -X -ap switches) would only extend out half as wide as it should.
11. Chart bi-sphere aspects bug: Chart spheres in bi-wheel mode and beyond would show improper aspect lines within charts other than the first chart.
12. Chart sphere glitch: Chart spheres display lines across the meridian with hatch marks at every degree. These hatch marks weren’t displayed at the 30 and 60 degree marks.
13. Bi-wheel sidebar display: Charts with no time or space wouldn’t display right in the bi-wheel chart sidebar. If chart #1 had no time or space, then all charts in the sidebar would be displayed as such. If only charts #2 or beyond had no time or space, then they would not be displayed as such, and would display bad data for their chart date (including corrupt data for the month).
14. Bi-wheel 3D houses bug: 3D houses wouldn’t display right in bi-wheels and beyond. Turning 3D houses on would adjust based on the wrong wheel, making planets jump wildly.
15. Transit relationship list: The text mode transit to natal and progressed to natal comparison charts (-rt and -rp switches) would display four charts (wrongly including the data for charts #3 and #4) instead of just two charts.
16. Text composite comparison: In the text mode comparison chart (-v -r0 switches), charts with no time or space (such as composite) wouldn’t be labeled as such, and would instead be shown with a bogus month.
17. Bi-wheel composite bug: Charts with no time or space (such as composite) wouldn’t work well in bi-wheels or beyond. The chart data would often snap to some chart with an actual time, or have the positions overwritten in some other fashion.
18. Command line crash: Putting the -tYn <years> switch by itself at the end of a command line would crash, when it should instead give an error message about the switch having too few parameters.
19. Command line aspect restrictions: The -RA switch would always toggle the status of aspect restrictions, even when specified as =RA or _RA which should force the aspect restriction on or off.
20. Quotation mark saving: Saving chart info files with a double quote character in the name or location fields would generate a corrupt file that would usually produce an error when loaded back into the program. Double quote characters will now be converted to single quotes when saved.
21. File error glitch: When attempting to load a file whose “.as” extension was explicitly specified, and that file wasn’t found, the error message would be “file.as.as not found”.
22. Graphic ephemeris glitch: Displaying the Part of Fortune in the graphic ephemeris (-E -X switches) would sometimes have the line for the Part of Fortune cross the entire window instead of wrapping, when passing over the 0Aries point on the edges of the chart.
23. Transit Influence selection: In the Windows version, selecting the Transit to Transit Influence chart in the Transits dialog wouldn’t automatically switch to text mode. If the program was in graphics mode, this could make selecting the transit influence chart seemingly do nothing (because you’d have to manually switch to text mode to see it).
24. Command line window sizing: Passing 0 to the -Xw switch is supposed to use the compile time default size for the window. On the Windows version this would instead use a default size chosen by Windows.
25. Rulership update omission: Updating the sign that a planet rules and co-rules with the -YJ switch wouldn’t update the reverse mapping (i.e. given a sign, determine what planet rules it) for the second co-rulership parameter.
26. Heliocentric Moon velocity: The relative velocity of the Moon in heliocentric mode (-h -v0 switches) would be much lower than it should be. (Velocities relative to average speed should always average about 1.0.)
27. Graphic date difference: Attempting to display the date difference comparison relationship chart in graphics mode would show chart #2 in the wheel, but have the sidebar show the data for chart #1, producing a weird state in which changing the chart data would only update the sidebar and seeming to leave the wheel frozen. The date difference chart has no graphics version, but that state should still show something understandable, namely just chart #1.
28. House system display glitch: Some houses aren’t defined in certain circumstances (such as Placidus and Koch near the poles). In such cases Astrolog will switch to Porphyry, which is expected behavior. However in such a case the actual chart would still be titled as using the original system, and not Porphyry, which isn’t accurate.
29. Metafile saving: Saving charts to Windows metafile format or copying them to the clipboard would sometimes produce display glitches in the file, if more than one file was created during the session. The second and subsequent files would sometimes have effects such as wrong colored text that’s no longer visible.
30. Command line warning: In the command line version, manually entering a half hour time zone when prompted such as “10:30w” would display a warning saying “Assuming unusual zone of 50 minutes after the hour instead of 30”. That warning is bonus, because the time zone will actually be a half hour (as will entering something like “10.5w”). You have to explicitly enter something like “10:50w” with a colon to actually get an unusual time zone 50 minutes after an hour.
31. Chart position limitation: The -YF switch which -o0 chart position files use to force an object to be a particular value, when called on a house cusp object, will now always set the object itself as well as the corresponding house cusp. The Angles are slightly different: Setting the Ascendant or MC objects won’t affect any house cusps, and setting the IC or Descendant objects will also set both the house cusp, as well as set the opposite house cusp to be 180 degrees opposite. This allows chart position files to properly cover cases where the Ascendant is different from the 1st cusp and/or the MC is different from the 10th cusp, and also cases where non-angular houses aren’t 180 degrees opposite each other. The old behavior had cusp object indexes 4 through 9 only set the corresponding house cusps (and also set the opposite cusps to be 180 degrees opposite), and it had the other cusp object indexes only set the cusp object (and set the opposite cusp object to be 180 degrees opposite). In other words, the old behavior didn’t properly handle house systems like APC in which opposite cusps aren’t 180 degrees opposite each other.
32. Compilation errors: The Astrolog 6.40 sources wouldn’t compile if certain compile time options were disabled. Specifically compiling with GRAPH, PS, or WIRE turned off would result in a few errors.
IMPORTANT NOTICE: Astrolog and all chart display routines and anything not enumerated below used in this program are Copyright (C) 1991-2019 by Walter D. Pullen (Astara@msn.com, http://www.astrolog.org/astrolog.htm). Permission is granted to freely use, modify, and distribute these routines provided these credits and notices remain unmodified with any altered or distributed versions of the program.
The main ephemeris databases and calculation routines are from the library SWISS EPHEMERIS and are programmed and copyright 1997-2008 by Astrodienst AG. The use of that source code is subject to the license for the Swiss Ephemeris Free Edition, available at http://www.astro.com/swisseph. This copyright notice must not be changed or removed by any user of this program.
Additional ephemeris databases and formulas are from the calculation routines in the program PLACALC and are programmed and Copyright (C) 1989,1991,1993 by Astrodienst AG and Alois Treindl (alois@astro.ch). The use of that source code is subject to regulations made by Astrodienst Zurich, and the code is not in the public domain. This copyright notice must not be changed or removed by any user of this program.
The original planetary calculation routines used in this program have been copyrighted and the initial core of this program was mostly a conversion to C of the routines created by James Neely as listed in 'Manual of Computer Programming for Astrologers', by Michael Erlewine, available from Matrix Software.
The PostScript code within the core graphics routines are programmed and Copyright (C) 1992-1993 by Brian D. Willoughby (brianw@sounds.wa.com).
More formally: This program is free software; you can redistribute it and/or modify it under the terms of the GNU General Public License as published by the Free Software Foundation; either version 2 of the License, or (at your option) any later version. This program is distributed in the hope that it will be useful and inspiring, but WITHOUT ANY WARRANTY; without even the implied warranty of MERCHANTABILITY or FITNESS FOR A PARTICULAR PURPOSE. See the GNU General Public License for more details, a copy of which is in the LICENSE.HTM file included with Astrolog, and at http://www.gnu.org
O*O*O*O*O*O*O*O*O*O*O*O*O*O*O*O*O*O*O*O*O*O*O*O*O*O*O*O*O*O*O*O*O*O*O*O*O*O
* Walter D. "Cruiser1" Pullen :) ! Astara@msn.com *
O Astrolog 6.50 homepage: http://www.magitech.com/astrolog/astrolog.htm O
* "Who am I, What am I? As I am, I am not. But as we are, I AM. And to *
O you my creation, My Perfect Love is your Perfect Freedom. And I will be O
* with you forever and ever, until the End, and then forever more." - GOD *
O*O*O*O*O*O*O*O*O*O*O*O*O*O*O*O*O*O*O*O*O*O*O*O*O*O*O*O*O*O*O*O*O*O*O*O*O*O